This guide answers the question, “how does Google Trends work?”
Below, you’ll find out how Google Search Trends works to provide data for specific queries so users can compare interest and popularity over time. You’ll also find out Google Trends can detect trending topics in real time and display that information in graphs and charts as numbers and percentages.
The ultimate goal here is to help you understand the complete process behind Google Trends so you know how to use it properly for your digital marketing campaigns. If you need a quick refresher about what this tool is used for, then check out this other guide on what is Google Trends.

How Does Google Trends Work?
Google Trends works by collecting an unfiltered sample of actual search requests made to Google and normalizing the data to make accurate comparisons between terms. The Google Trends process also uses anonymized, categorized, and aggregated data based on the time and location of the query.
Unfiltered Sample Data
Google Trends only collects a sample of Google searches for users to explore, measure, and analyze in the tool. Google’s search engines handle billions of searches per day and processing a dataset that large would be too much work to perform in real time. By sampling only a percentage of search requests, Google Trends can display a good representative dataset for all Google searches within a matter of minutes; not hours or days.
Additionally, Google Search Trends works with an unfiltered dataset. This means that the search data reported in the tool reflects daily searches made by real people on Google’s platforms as well as irregular search activity from automated searches by machines and queries that are used to spam the search results. Google doesn’t filter out the irregular searches from the system because doing so would inform users that the algorithm has identified them, could could then make it more difficult to target that activity in Google Search products.
Trends Data Is Normalized
Google Trends normalizes search data to the time and location of a query. Data normalization means that the data is organized in a way that appears similar across all search terms. Normalized data is important because it makes it easier to compare two or more terms without skewing the results in favor of one term based on search volume. Without data normalization, locations with the highest search volume would always rank the highest and seem to be the most popular.
How Google Trends works to normalize is by dividing each data point by the total searches of the geography and time range it represents and assigning it a value on a scale between 0 to 100 to accurately compare popularity between search terms. (More details on this scoring method in the next section.)
Trends Data Is Anonymized
Google Search Trends only works with anonymized data so no one can be personally identified through the system. Data anonymization is the process of protecting private or sensitive information for individuals by erasing or encrypting identifiers that connect that person to stored data.
Trends Data Is Categorized
Google Trends categorizes data by grouping search queries into topics. This allows the data exploration tool to display related queries for each search term based on categories like Arts & Entertainment, Finance, Real Estate, Travel, etc, to help users find other relevant topics to measure and analyze. You can also narrow your searches down to specific Google products, such as Web Search, Image Search, Google Shopping, and YouTube; making Google Trends one of the best tools for how to find the most searched keywords on Google for search engine optimization (SEO) and digital marketing campaigns.
Trends Data Is Aggregated
Google Search Trends also aggregates all of the data within the unfiltered dataset. This feature is what allows the tool to display search interest for any topic based on the geographic location of users around the world, including subregions, cities, and metro areas.
Google Trends Numbers Explained
Google Trends numbers are scaled on a range between 0 to 100 based on the relative search interest of a topic in proportion to all searches on all topics. A value of 100 indicates peak popularity of the term while a value of 50 means the term is half as popular.
Trends Graph Numbers
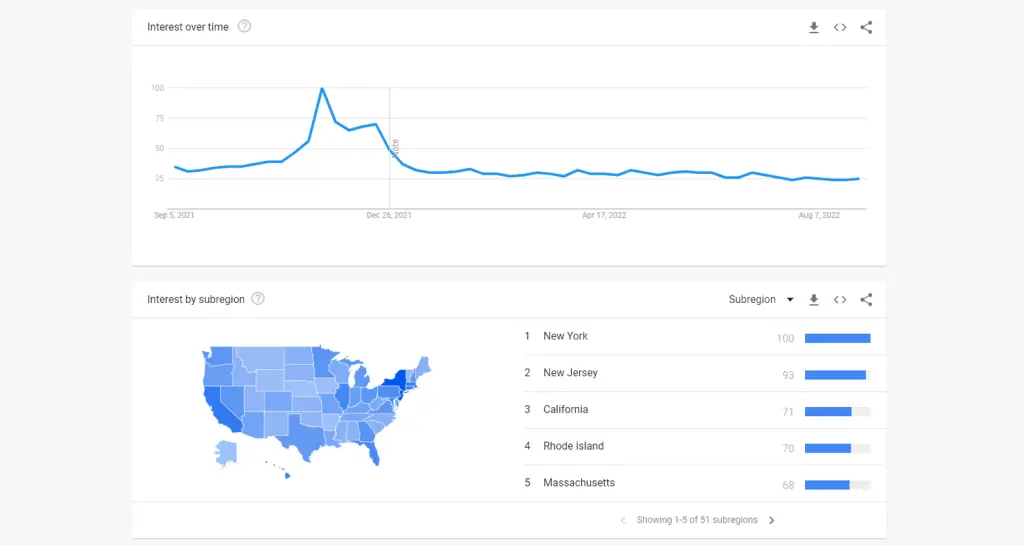
The Google Trends graph that displays Interest Over Time for a particular topic or term does not represent search volume numbers. Instead, it reports an index ranging from 0-100 for user interest based on normalized data for the selected location and time.
One thing to keep in mind when reading Google Search Trends numbers (or scores) in the graph is that trend data only shows for popular terms during the selected time frame and geographic location. Therefore, scores of 0 on the Interest Over Time graph mean that an insufficient amount of data was available for the query based on the sample dataset. It doesn’t necessarily correlate with 0 search volume in Google’s search engines.
Trends Chart Numbers
The Google Trends chart for Interest By Subregion works by displaying numbers between 0 to 100 based on the relative search interest of a topic in a particular location. However, values are calculated based on the fraction of total searches in that geographic area. This means that the subregion with the highest value (100) had a higher proportion of searches for that query; not a higher absolute query count.
For example, a small city where 90% of the queries are for “gas prices” will get twice the score of a larger city where only 45% of the queries are for “gas prices”. This type of data processing helps you find trending topics more easily by subregions without total search volume skewing the results.
The numbers in the Related Topics and Relate Queries charts are reported as percentages between 0% to 4,999% based on search interest. If you see “Breakout” next to a term instead of a percentage, then it means the search term grew by more than 5,000% for that selected location and time.
Accuracy of Google Trends
Google Trends is accurate according to the data sources it pulls from Google search. Real-time data in Google Trends is an accurate sample covering the previous 7 days while non-real-time data goes back as far as 2004 and up to 72 hours before your search.
However, even though Google ranks #1 for the top 100 search engines in the world, it’s not the only platform on the Internet where people conduct searches. Therefore, the data in Google SEarch Trends does not reflect search interest on other platforms which may be higher or lower for specific terms.
Google Trends also filters out some types of searches, including:
- Searches Made By Very Few People: In this case, the term’s score will be reported as a 0 on the graph.
- Searches with Special Characters: Queries with apostrophes and other special characters unless it’s part of a brand name.
- Duplicate Searches: Terms that are searched for repeatedly by the same person over a short period of time are removed for better reporting accuracy.
The Way Google Trends Works Summary
I hope you enjoyed this guide answering the question about how does Google Trends work.
As you discovered, Google Trends works by collecting an unfiltered sample of search requests made on Google platforms and normalizing that data to make accurate comparisons between terms. Search results data is also anonymized, categorized, and aggregated based on the time and location of the query.

SEO Chatter is dedicated to teaching the fundamentals of search engine marketing to help marketers understand how to increase organic website traffic and improve search engine rankings.